
Inside The SimpleTrends App
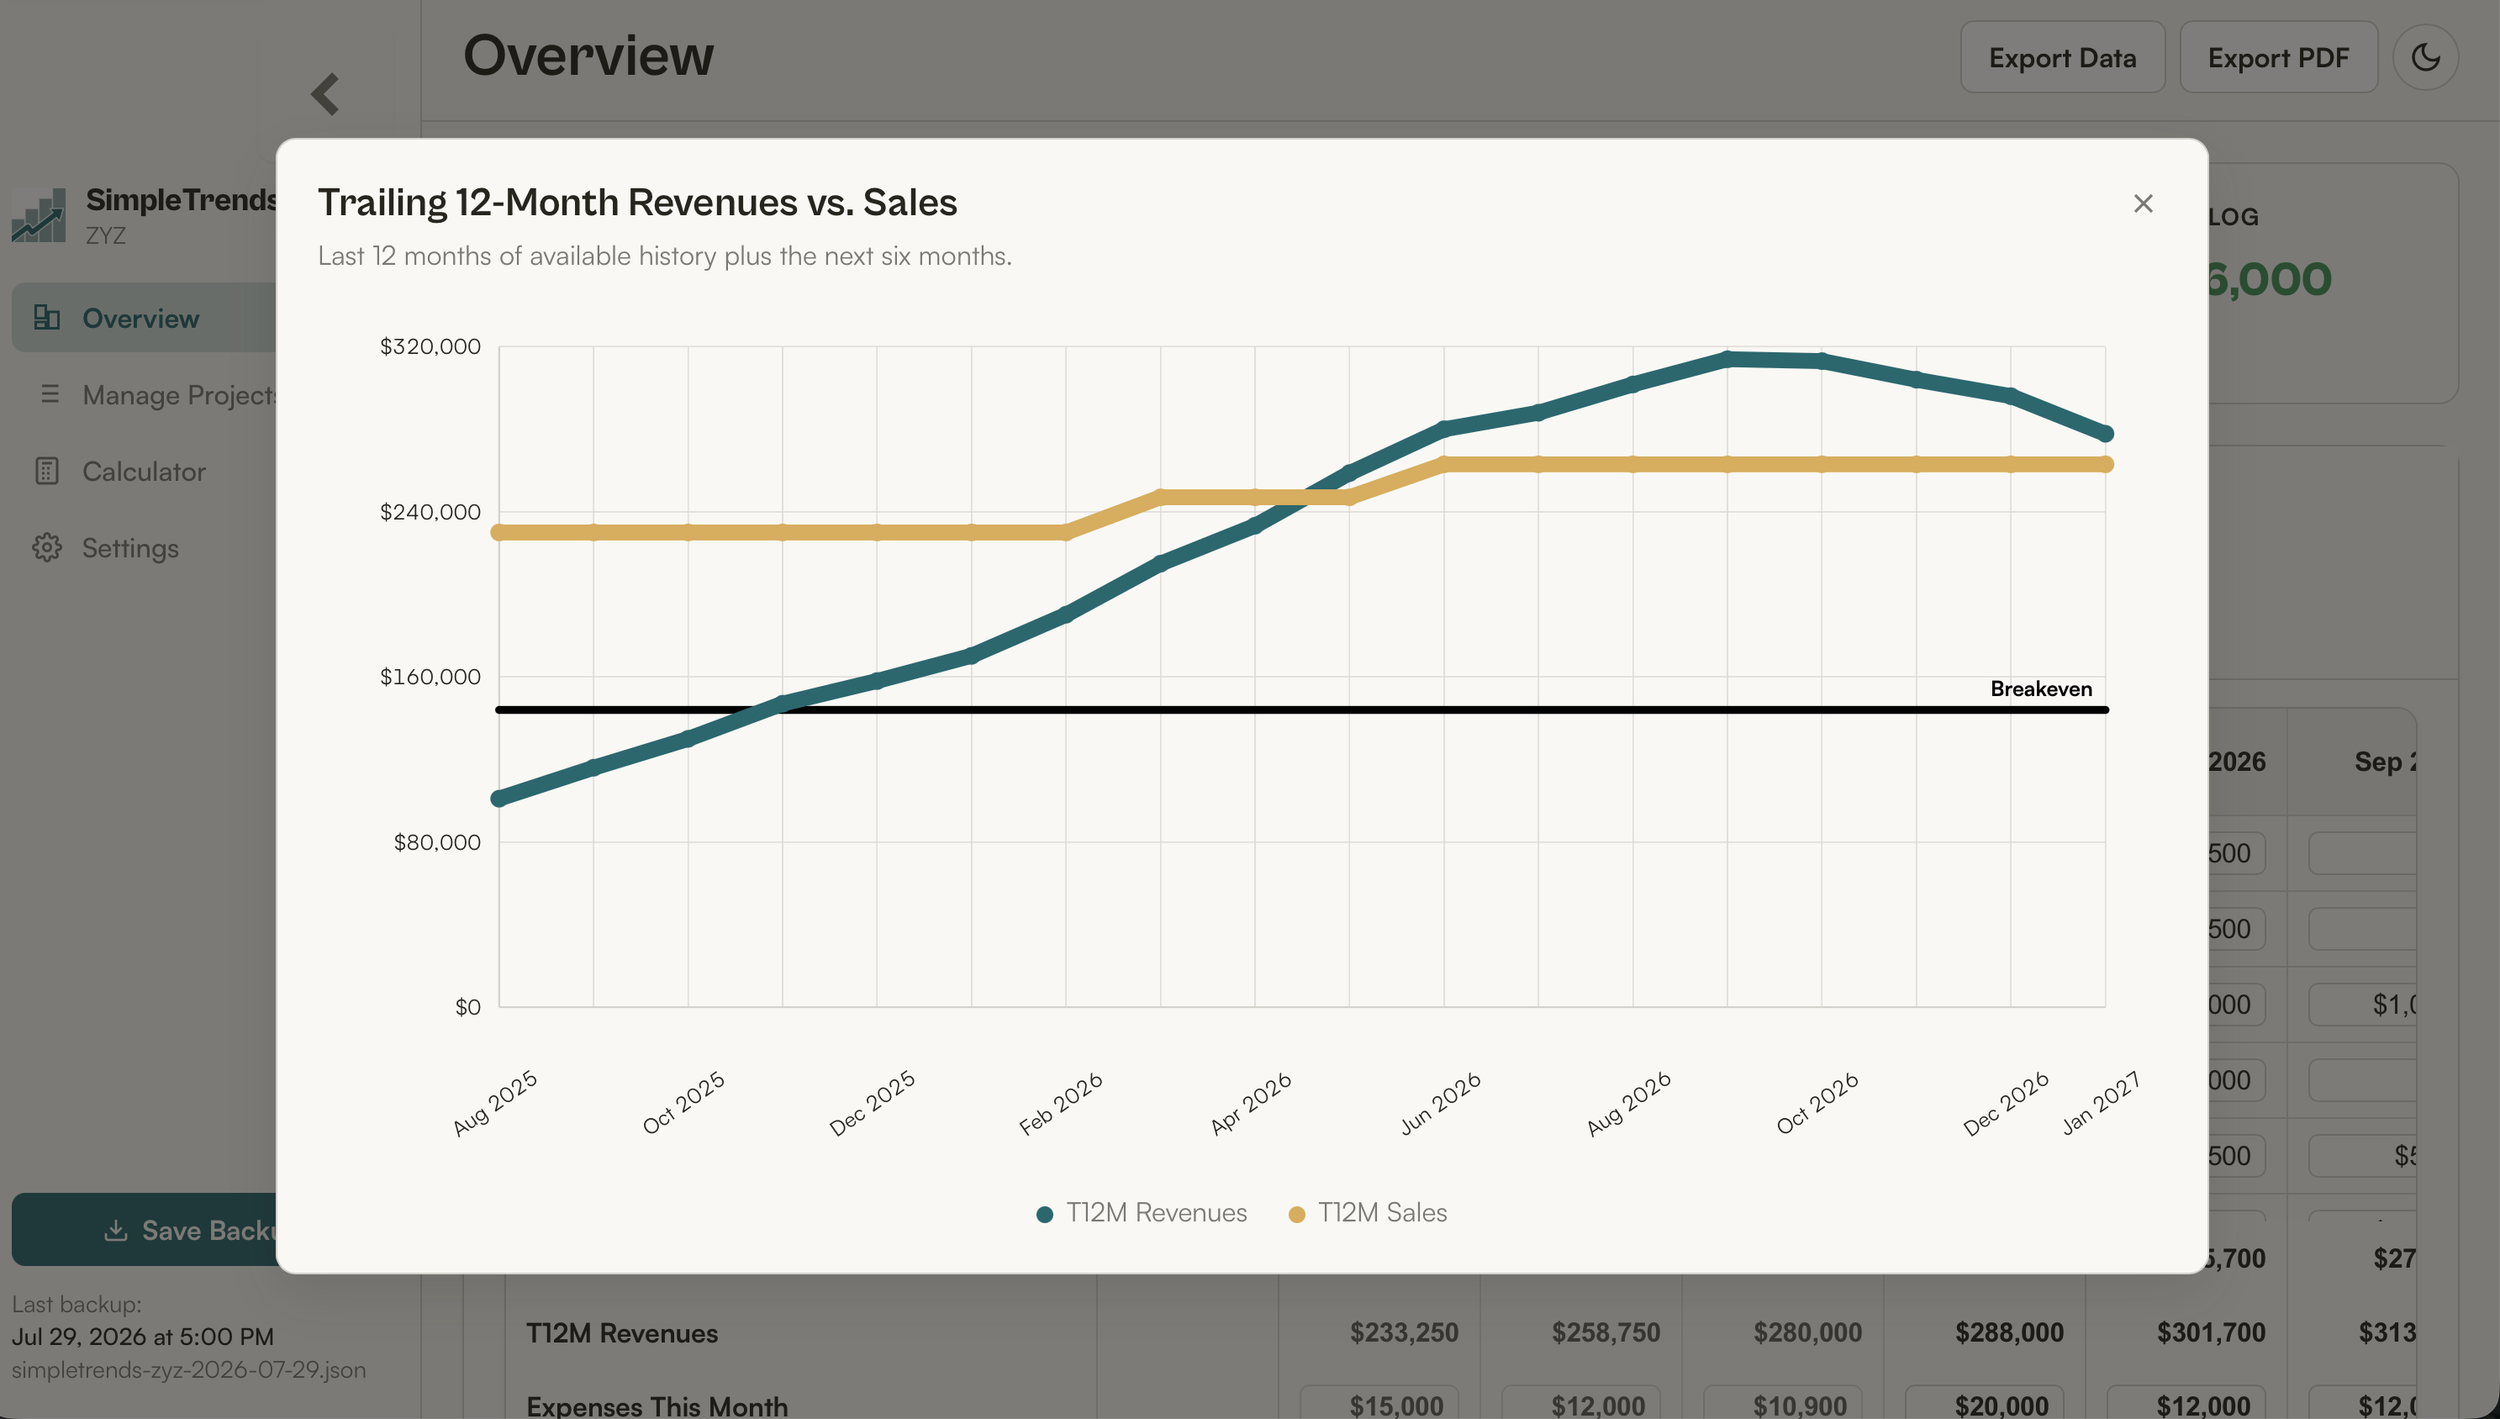
Using SimpleTrends To Predict The Future
SimpleTrends documents your two most important metrics and extends their predictable future to give you feedback on how well you are doing.
SimpleTrends is an app that is based on a complicated spreadsheet that I used for years in my firm. You can get a copy of that spreadsheet if you want; I call it OFFPLAN. I used it to plan how we could meet deadlines, to forecast how long our backlog would realistically last. I sometimes plugged in anticipated sales to see their effects, etc. I found it very useful, especially in spotting slowdowns and planning work accordingly. The SimpleTrends App does all that better and easier. With OFFPLAN there was periodic maintenance of the spreadsheet, SimpleTrends completely eliminates that.
Below are annotated screenshots of SimpleTrends to show you what it is like.
Quick Overview
First a quick introduction to the Overview and Dashboard before getting into the details. You can find a more detailed commentary on using SimpleTrends in the Quick Start Guide.
A) The sidebar menu for changing views. The arrowhead collapses and open the sidebar.
B) These four cards track your Key Prerformance Indicators [KPI].
C) These buttons export your data or create a PDF of your Overview.
D) Your Project-Phases are listed here and the ‘Fee Balance’ column shows how much fee has not been allocated yet.
E) Your month by month allocation of Project-Phase fees with the current month highlighted. These are added by simply clicking in the cell, or updated by overwriting them.
F) All your calculations are shown here. Everything updates instantly as data changes. The actual current month’s expenses is the only one you update.
G) All your data is automatically saved as you go, BUT saving backups with this button should be done after every update session.
Setup
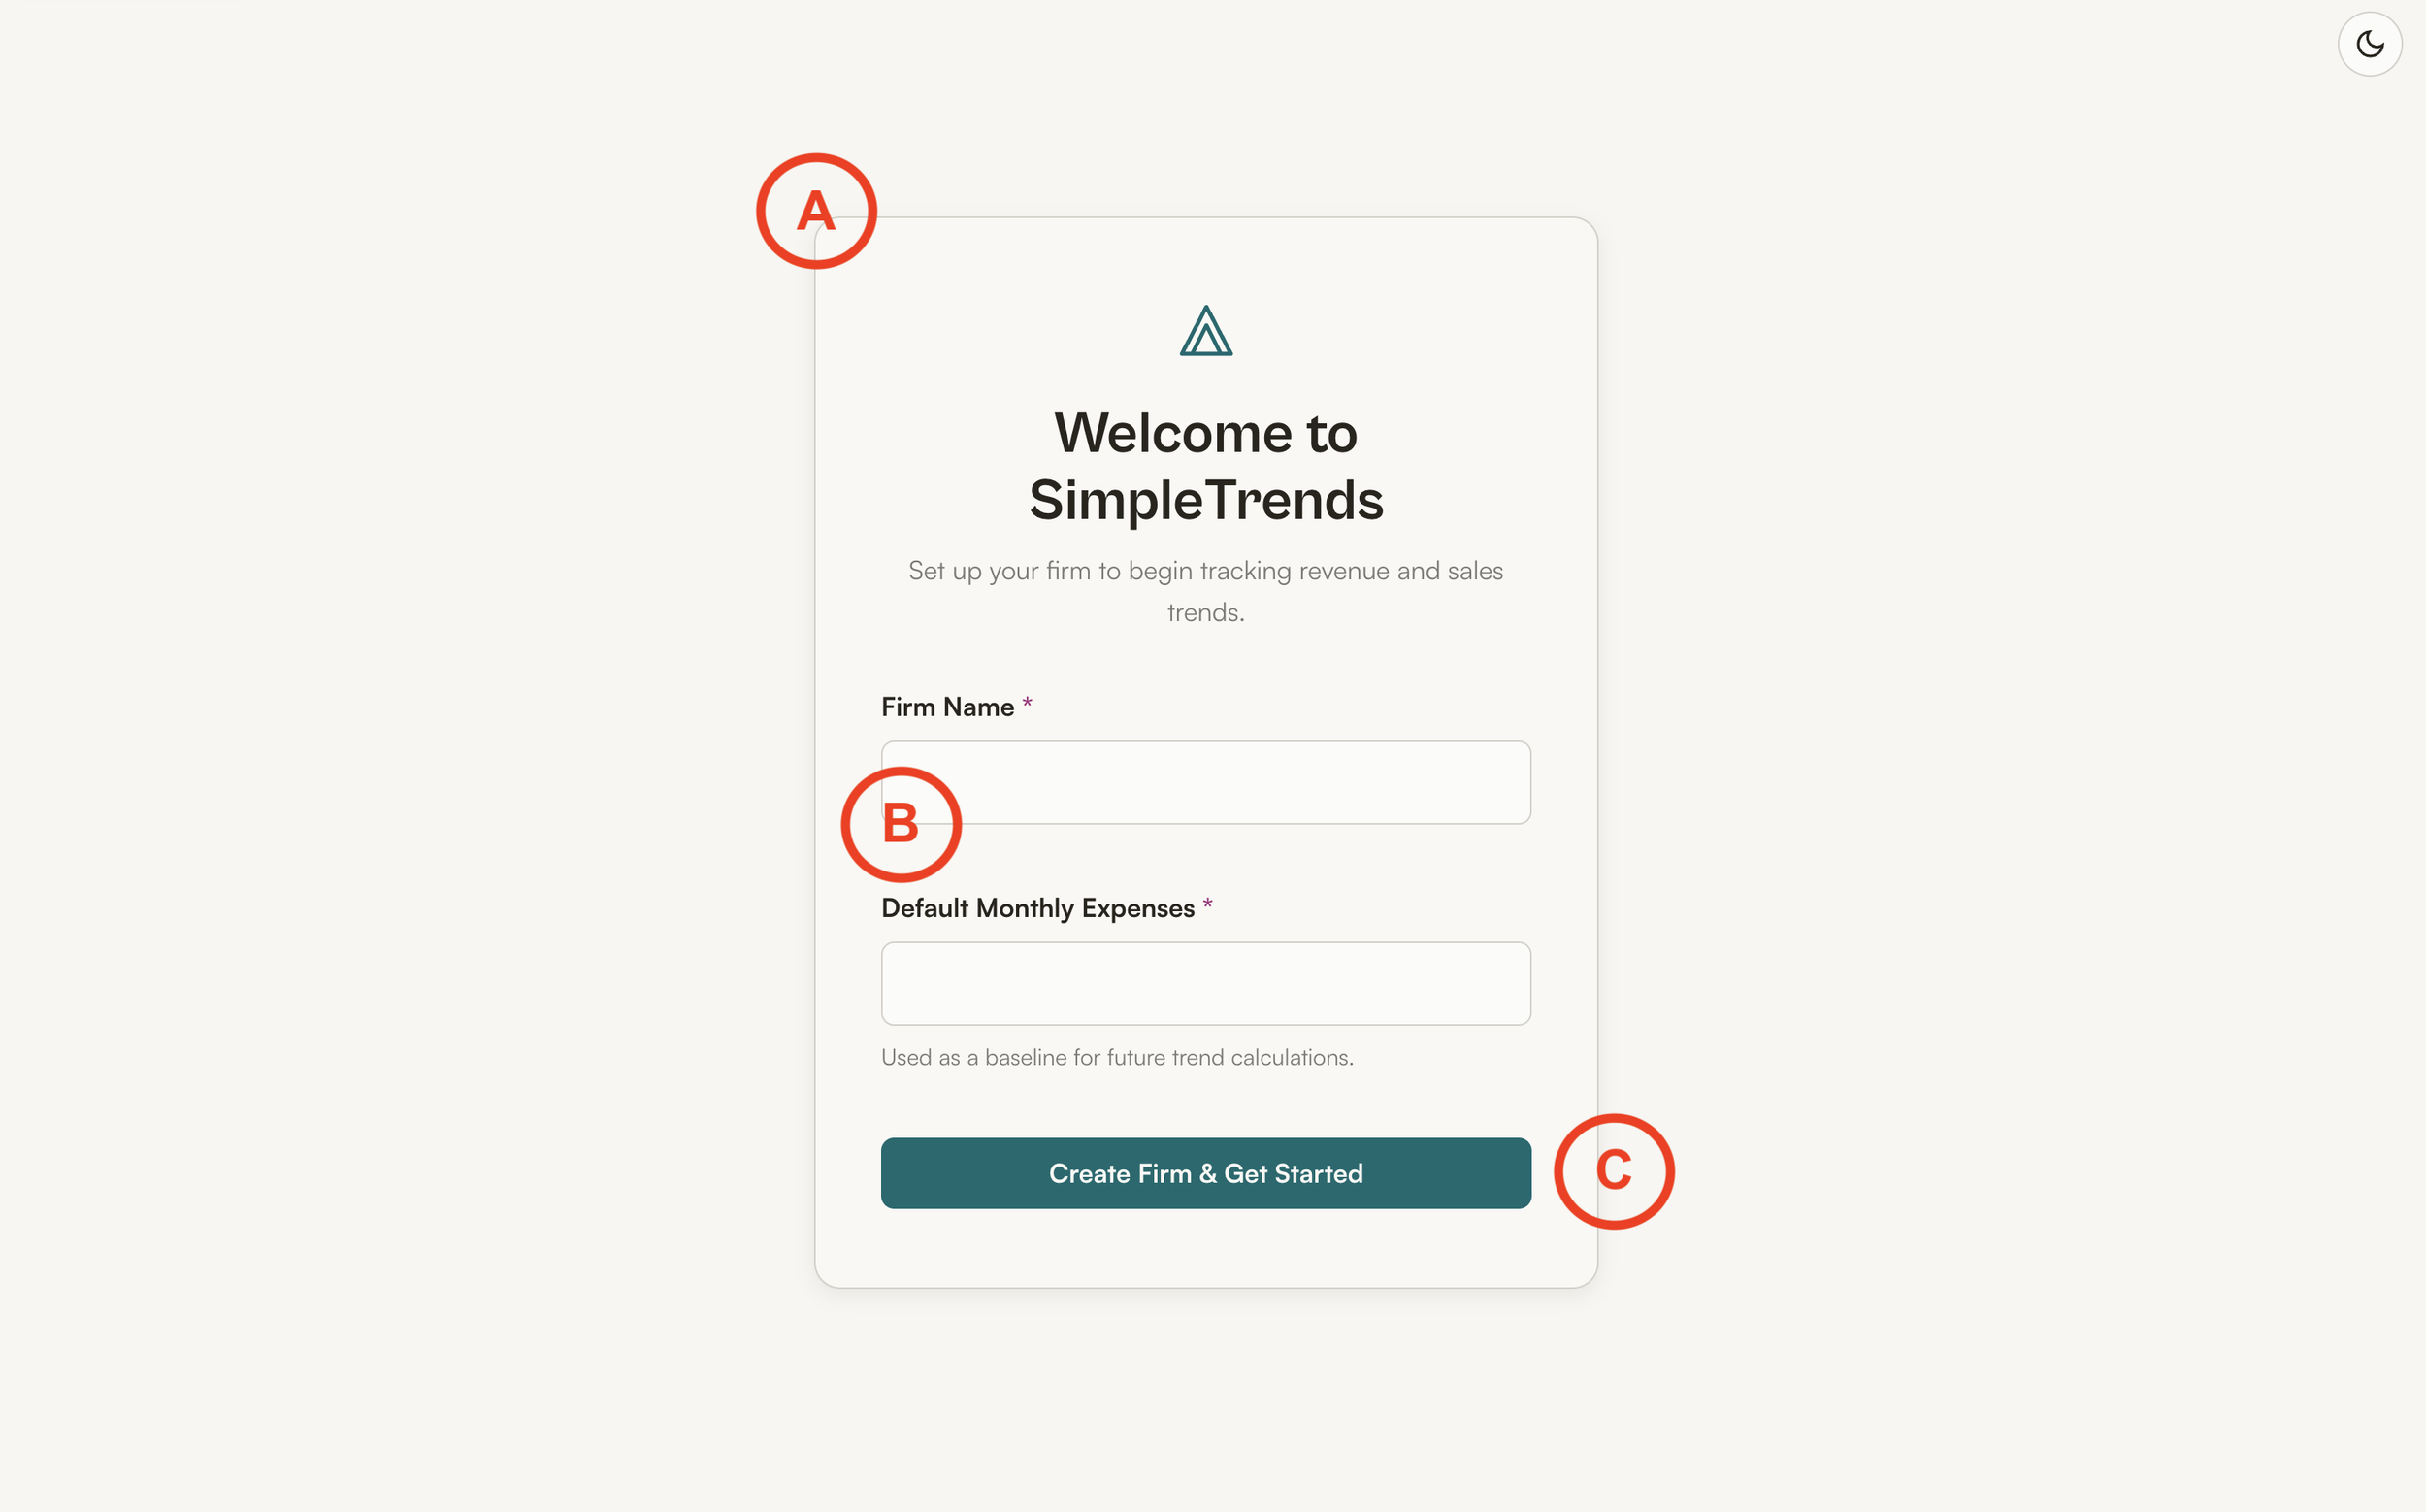
This is the welcome screen.
A) This is shown only on your first opening of the app.
B) Enter firm ID to be used in file names; then add your average monthly expenses amount to be used in projections.
C) Create your data file. This moves you to the next screen below.
Getting Started
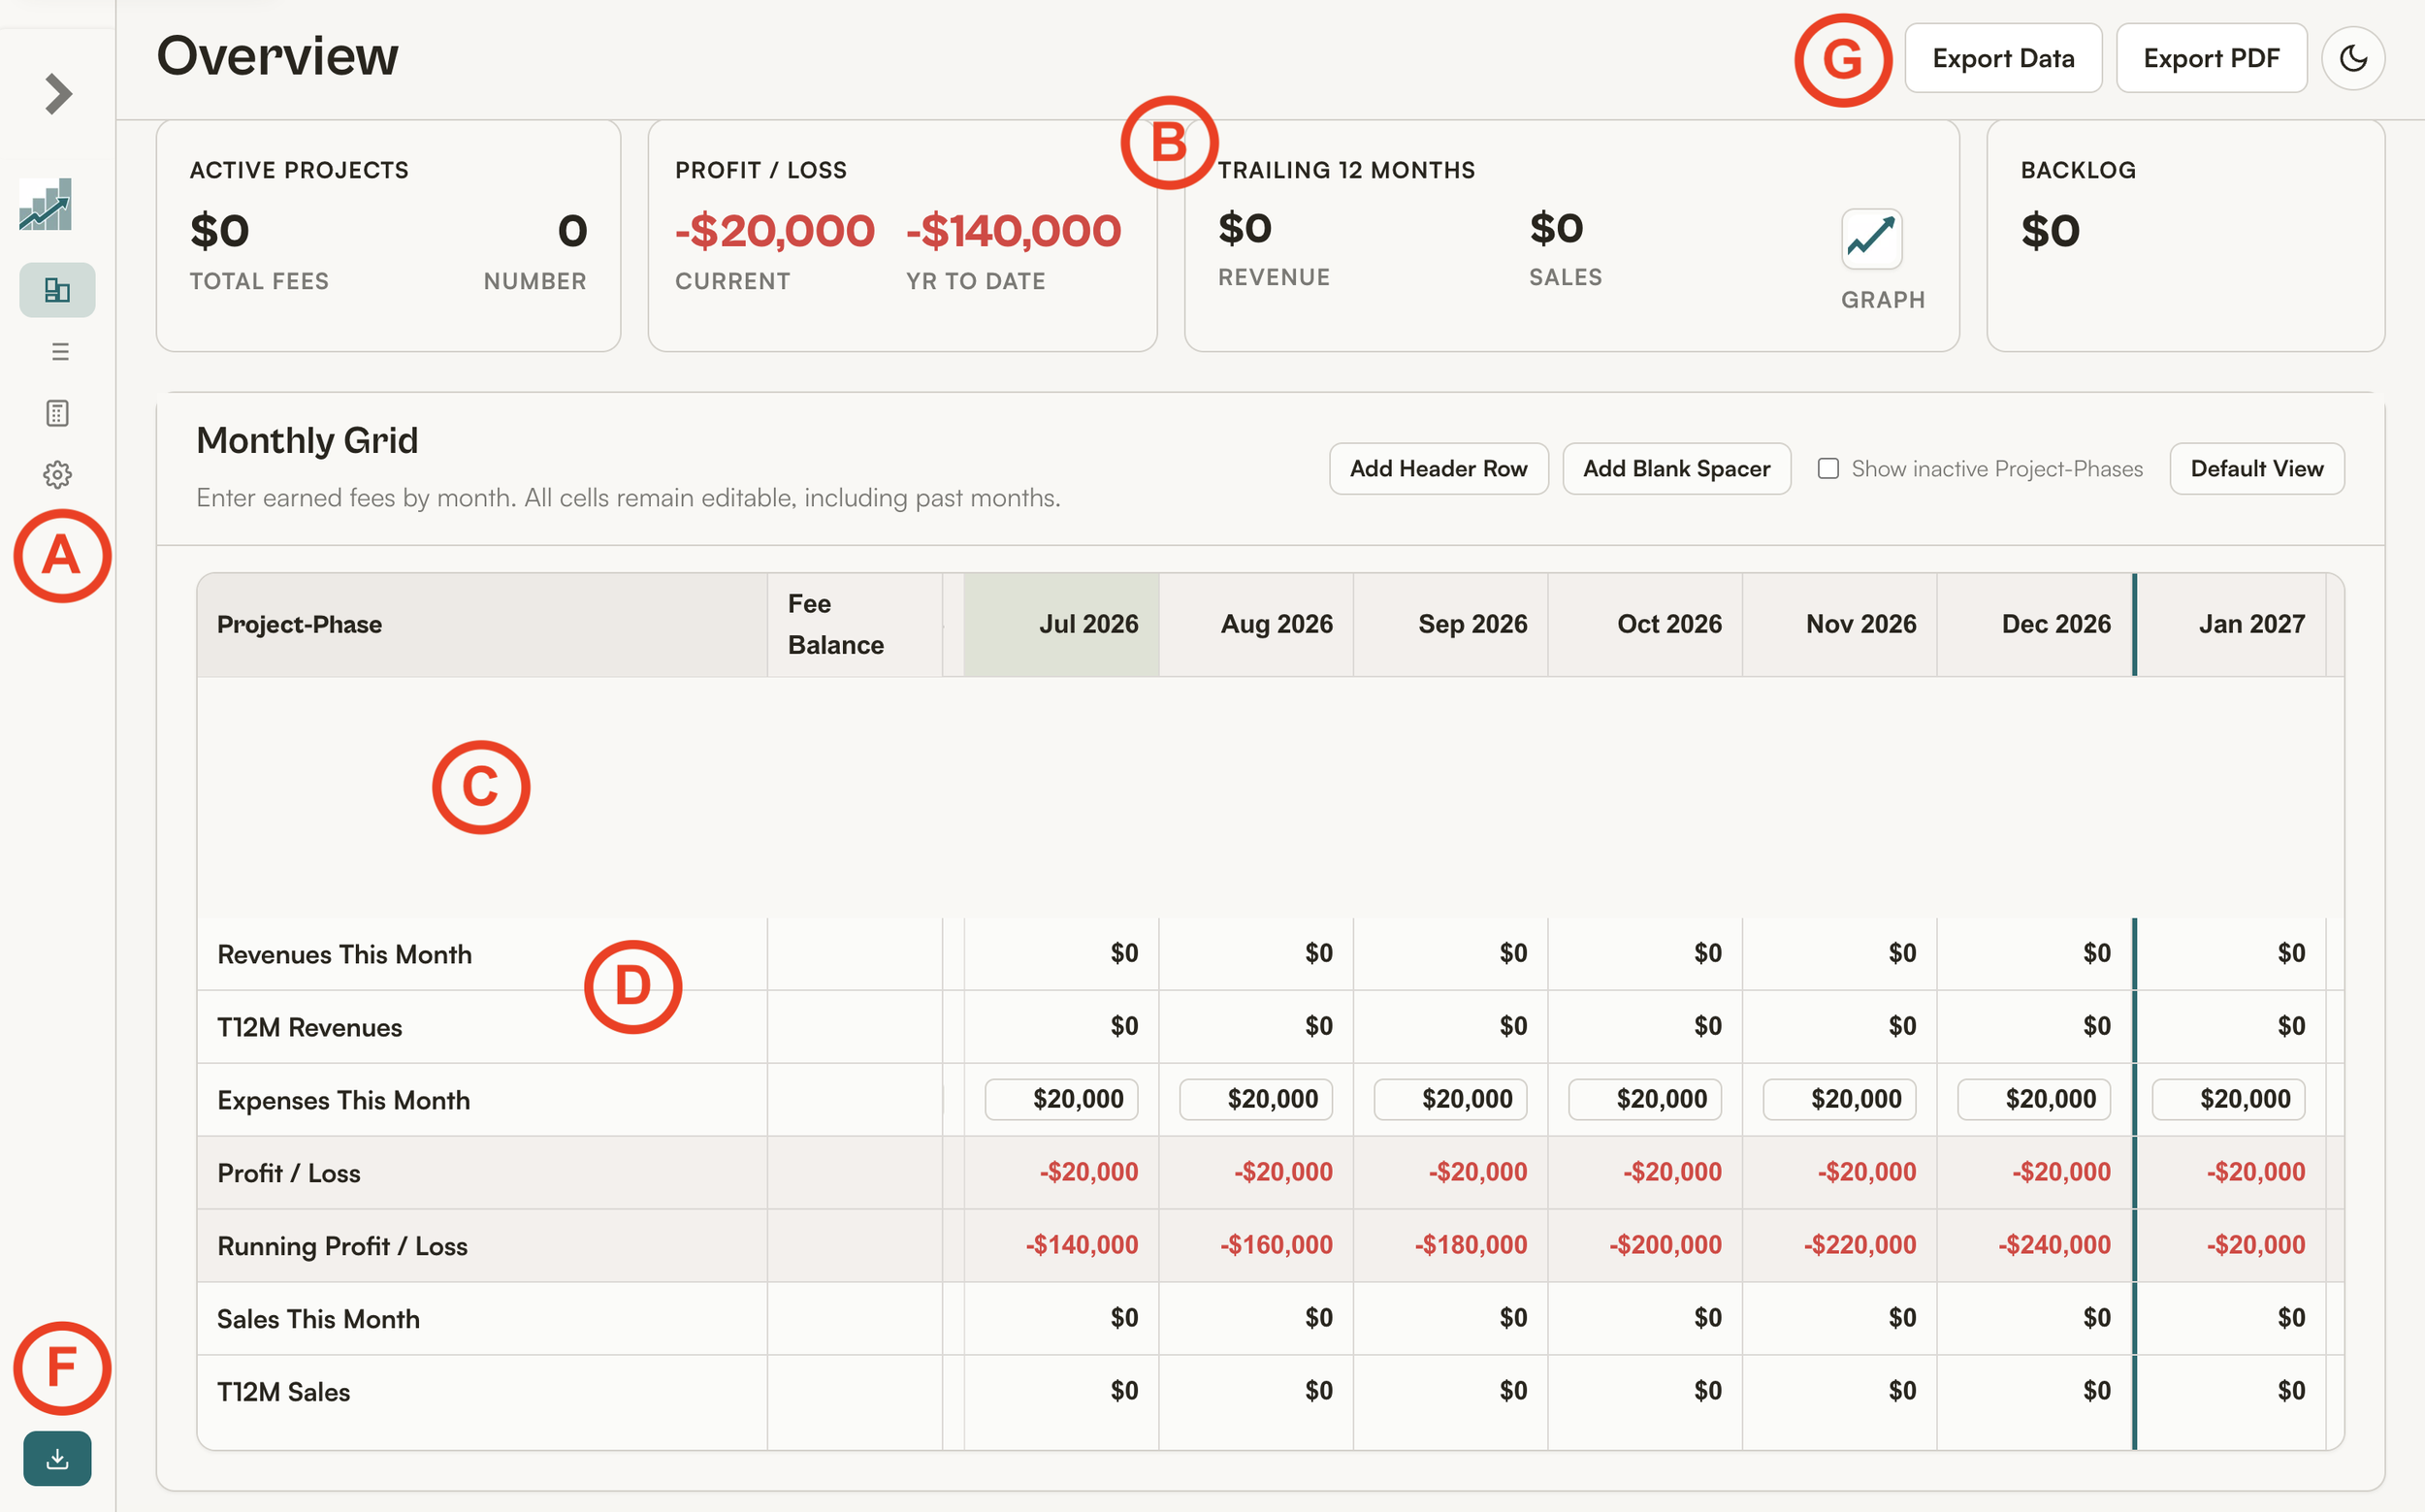
When you first get started this is what you see.
A) The sidebar menu, shown collapsed here.
B) Your empty KPI dashboard. The negative profit/loss numbers are due to the automatic insertion of the monthly expenses amount you entered on the setup screen.
C) Your Project-Phases will display here. You can rearrange them by drag and drop.
D) These seven rows hold all your automatic calculations.
F) The Backup button. Very important.
G) Buttons for exporting and printing.
Adding Projects
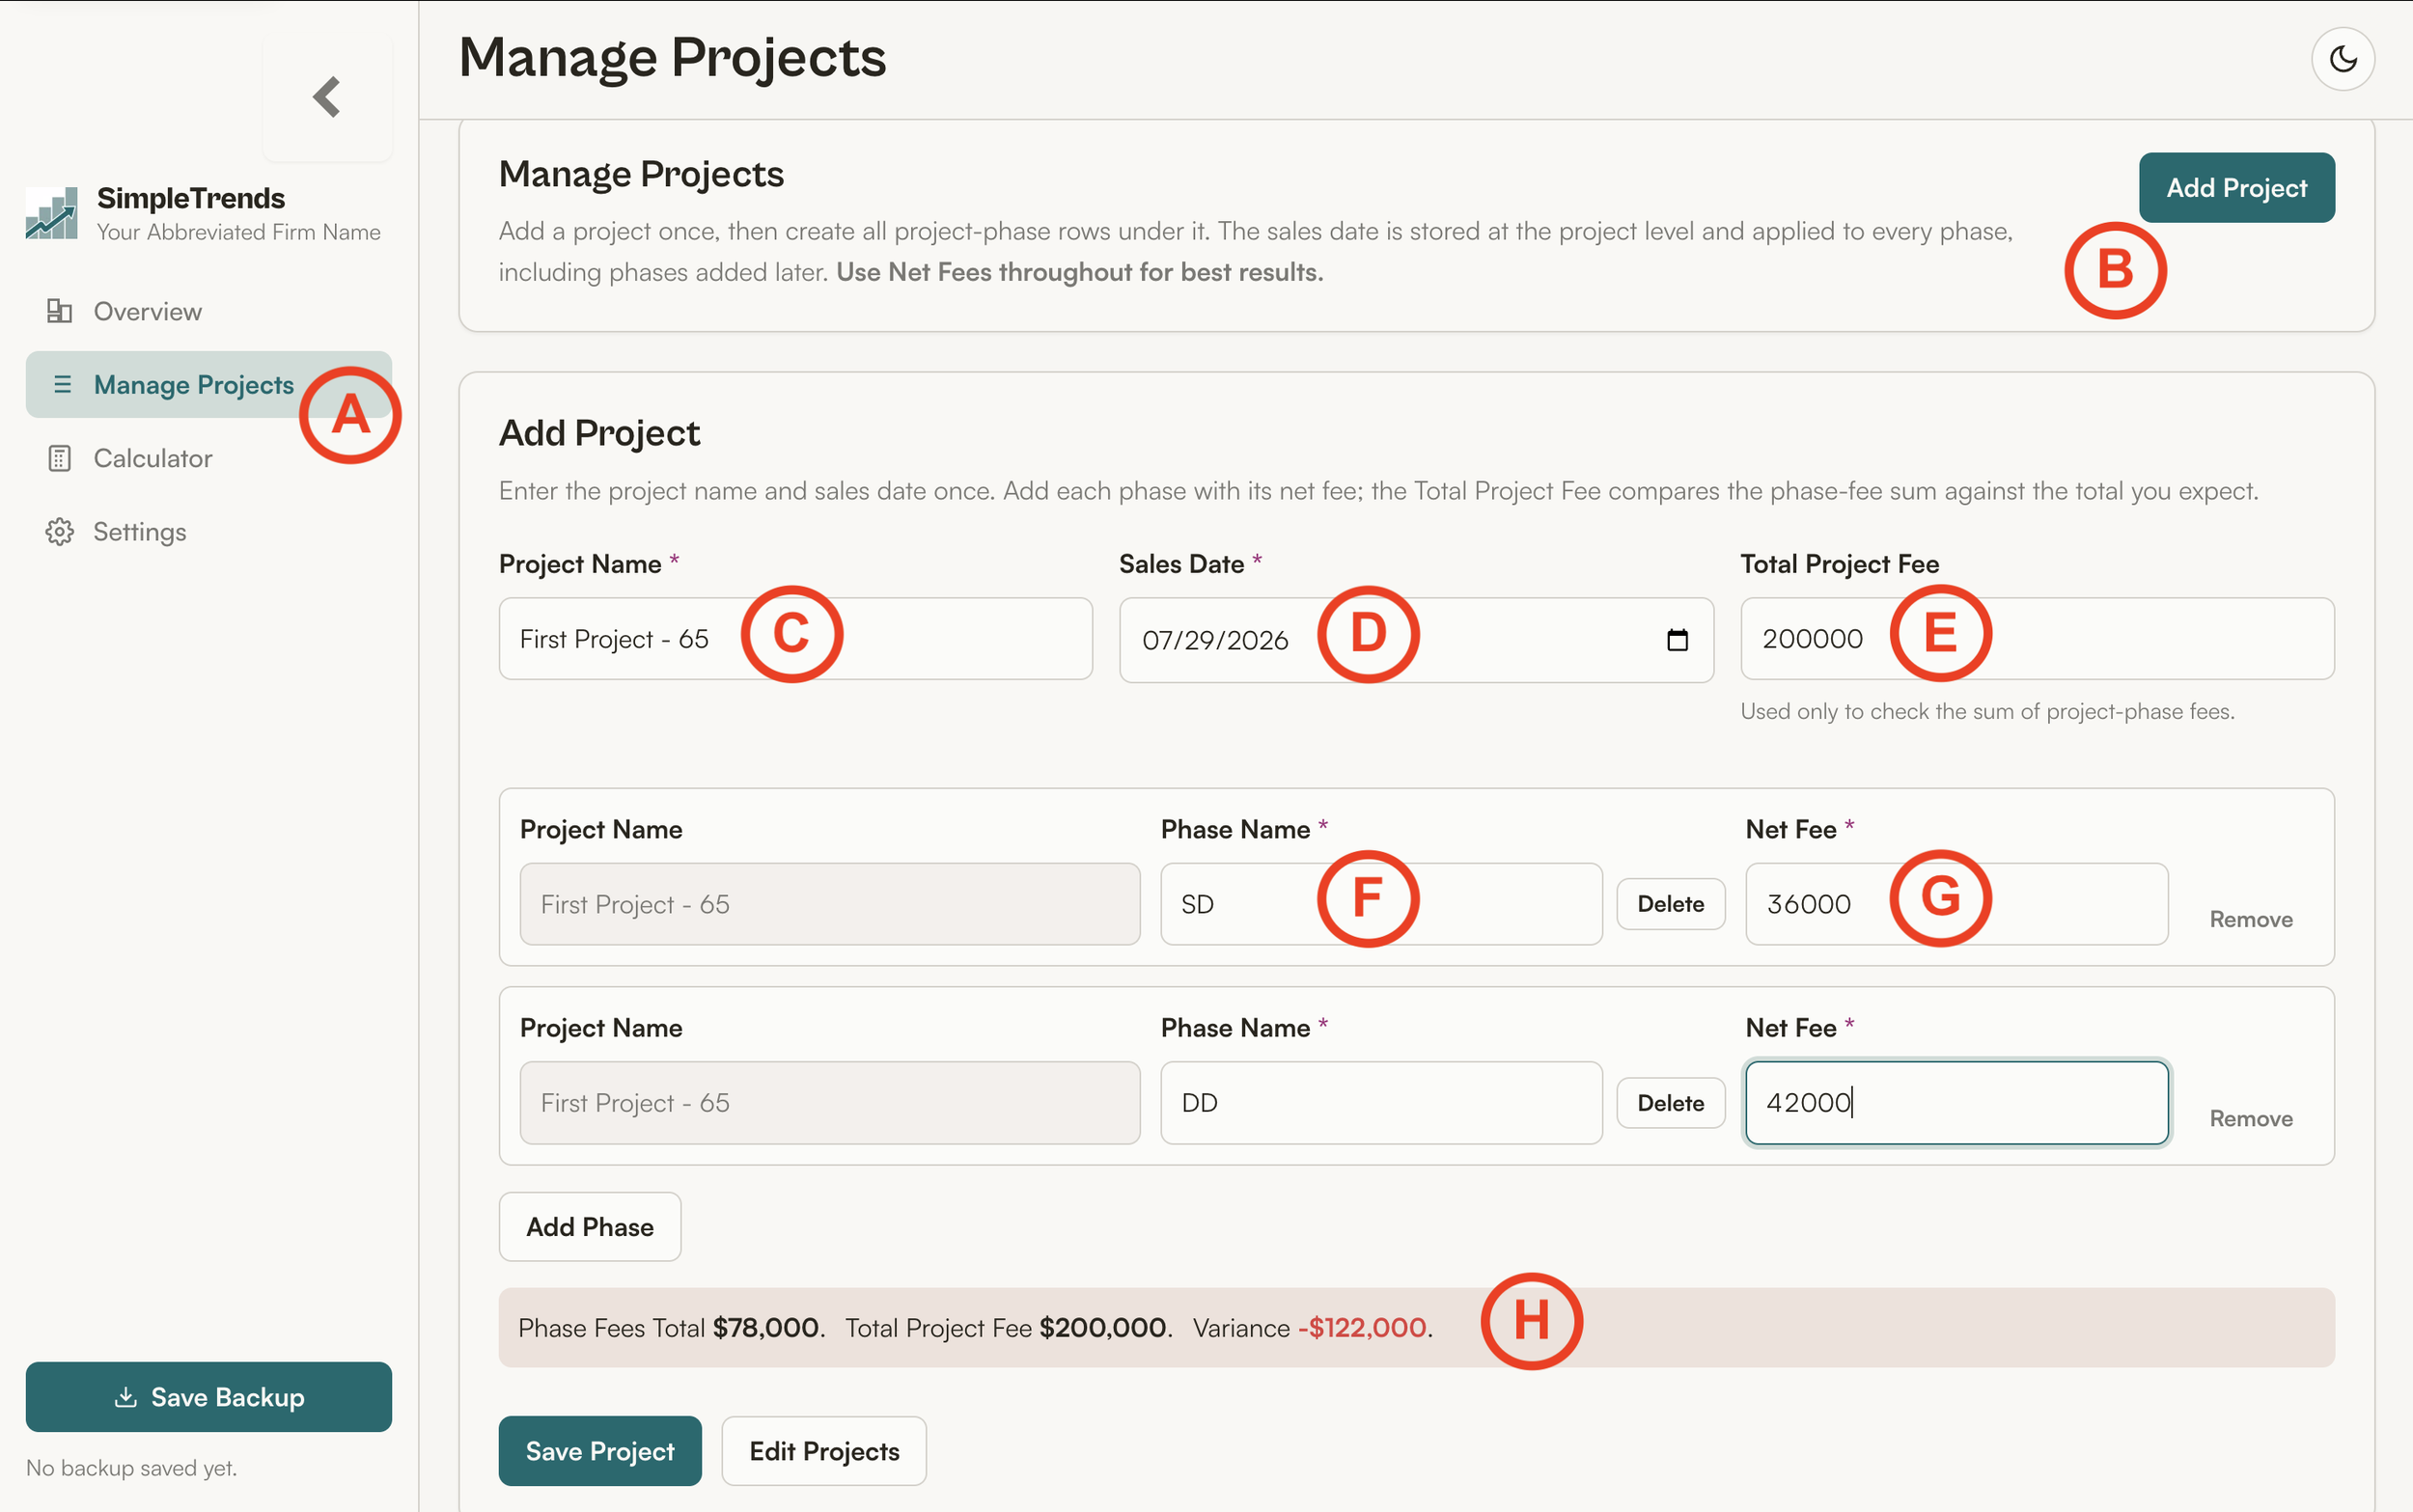
To start adding your projects, this is the process.
A) Select ‘Manage Projects’ from the sidebar menu.
B) Click ‘Add Project’ to open a blank project as shown.
C) Name your project. A short identifier is recommended.
D) Select the date that the project started. This is used to build you ‘Sales’ trend.
E) The Total Project Fee here is used to assist in the next step of adding Project-Phases.
F) Phase names can be selected or created.
G) The Net Fee for this phase.
H) If you have entered a Total Fee in E), then the variance is calculated for you.
Allocating Fees
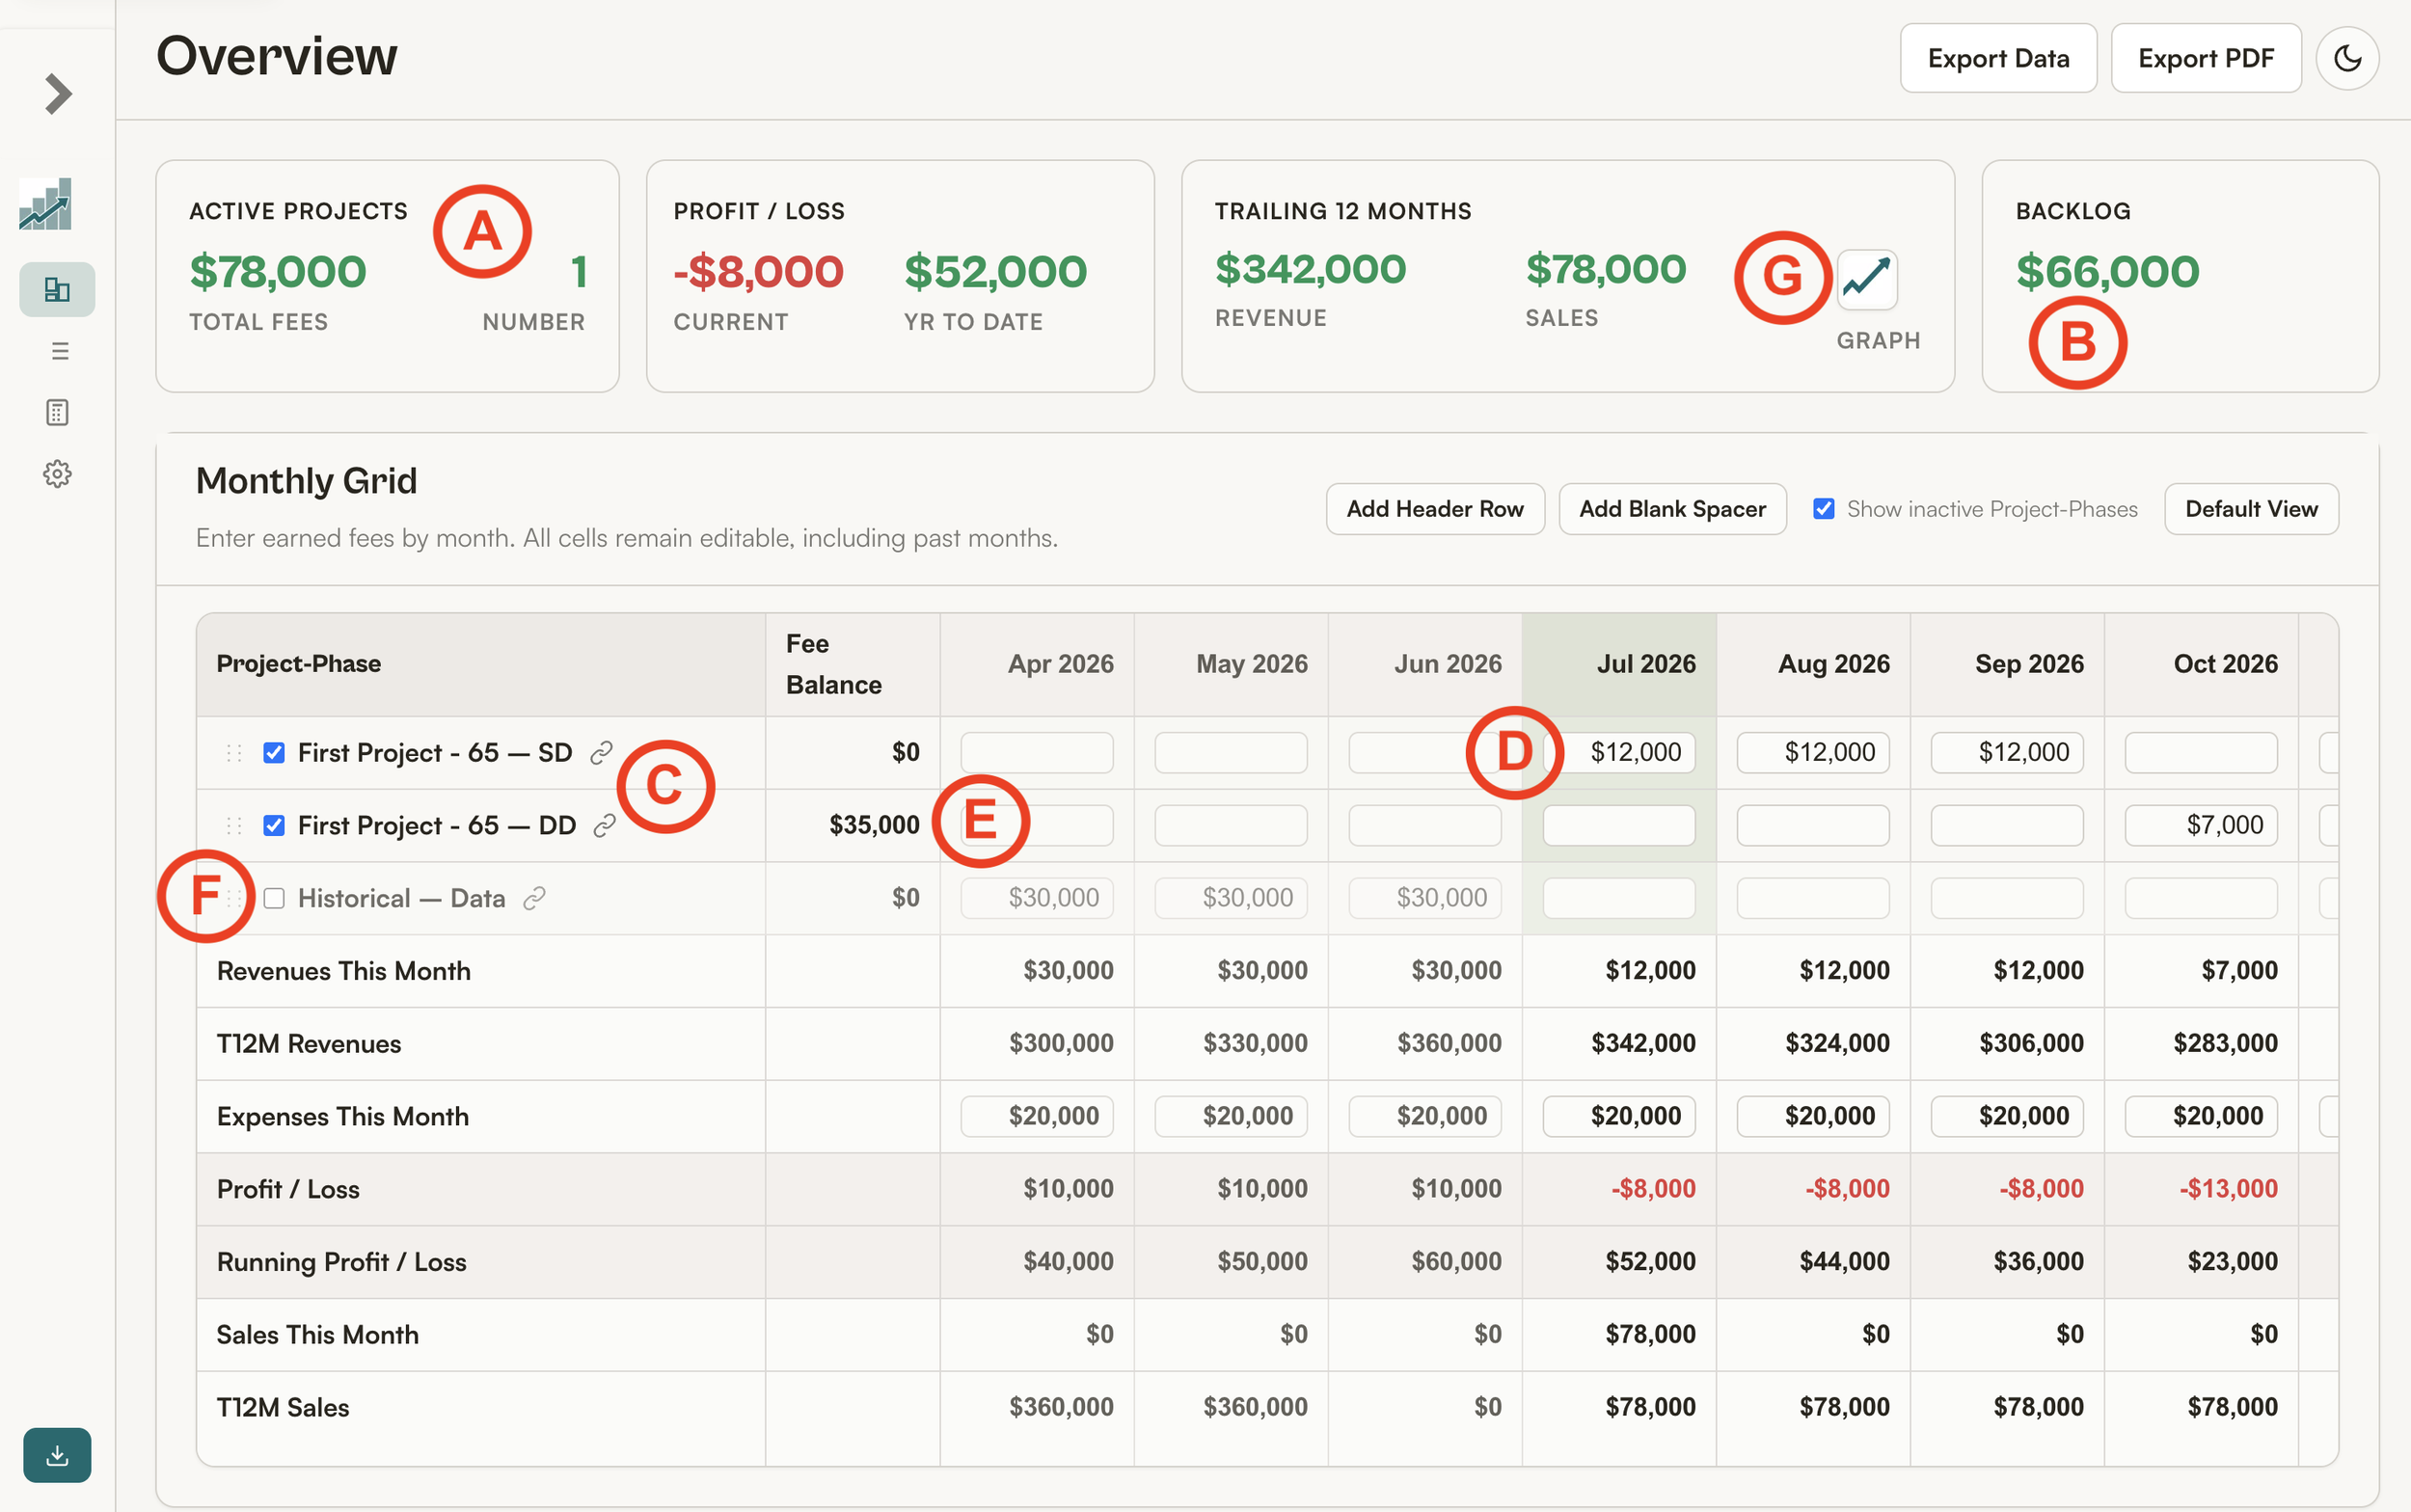
The next step after adding a project is to allocated the fee over the coming months.
A) The dashboard will update with each entry you make.
B) The Backlog shows how much of your fees lie in the future.
C) Your Project-Phases that you have marked ‘active’ are listed here.
D) Enter your estimated amount of the Project-Phase fee that will be billed each month.
E) A Fee Balance shows here if you have over (or under) allocated the fee.
F) An example of an inactive Project-Phase toggled ‘on’ from the Monthly Grid menu bar.
G) This icon opens a graph of your Revenue and Sales trends. See the top image on the page.
The Benefits of SimpleTrends
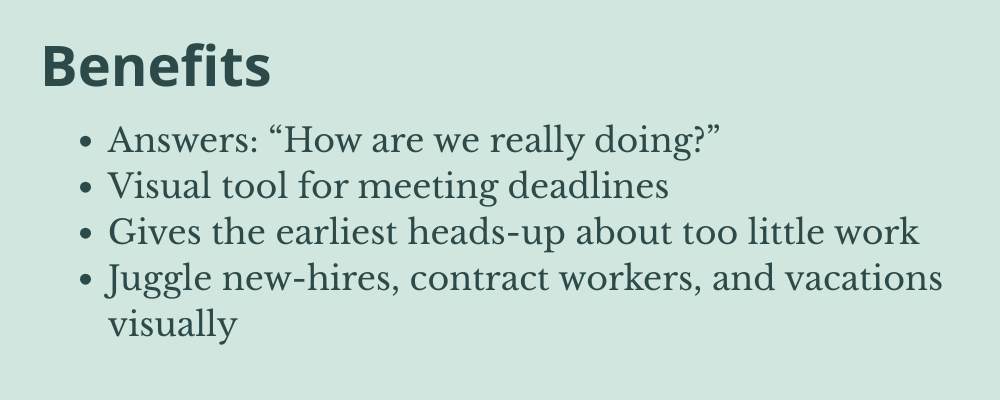
The main benefit from using SimpleTrends is that with very little time each month you can have access to objective information about your firm’s situation - growing or shrinking backlog, profitability forecast and more.
The other benefits are:
Answers “How are we really doing?”
A visual tool to help you meet deadlines
Gives you an early ‘heads-up’ about too little work in the pipeline
Adjust estimated fees earned to see the impact of new-hires, contract workers, and vacations visually
Availability
SimpleTrends can be purchased for $95, and you can find more info here.
