|
Usually I am not keen on collecting historical data, especially financial data. But this is a little different because of how the data can give you a glimpse of the future. That is pretty handy. To implement this idea you only need to commit to spending about 3/4 to 1 hour per month. Add a little more time for the initial setup and for a total commitment of 12-15 hours the first year you are on your way to projecting the future. This recent post explains how to do it yourself. To clarify, what I am proposing is to project your current workload into the future on a routine basis. By logging in your actual results as well, you can monitor how your workload is trending. A "Trailing 12 Month" trend provides really good data for recognizing a downturn or for verifying an upturn. Undoubtedly you have a hunch about how things are going. Having some real facts to go with your hunch has a lot of benefits. I would rather know how the next two months are going to play out rather than just think things will be OK. Maybe things will be fine if you implement one particular strategy - but not just any strategy. Here are some benefits that I have experienced.
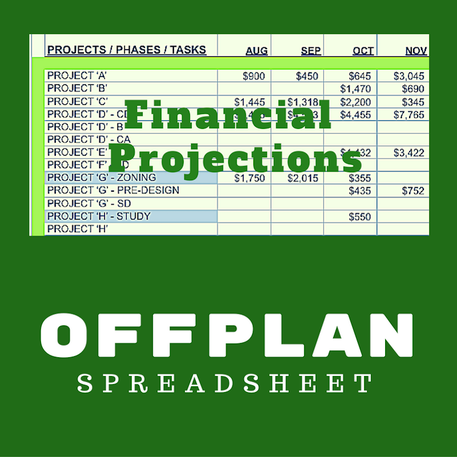
The method that I used is called "OFFPLAN", which is just the name of the spreadsheet I had for tracking our workload.
Take a look at how to set up your own projections spreadsheet in this article OR buy my spreadsheet [$22] and fill in your own data. Comments are closed.
|
x
Archives
February 2024
Categories
All
|
Architekwiki | Architect's Resource | Greater Cincinnati
© 2012-2022 Architekwiki
© 2012-2022 Architekwiki


