 Lucidchart Diagramming Lucidchart Diagramming Lucidchart is a Google Chrome browser App for making diagrams, flow charts, organizational charts and similar tasks. You work on a 'paper' workspace in your choice of size and while you can make elements a specific size for a to-scale drawing; that seems like a good way to drive yourself crazy. I have used Lucidchart to make flow charts of work processes. This helps you think the process through as well as give you sharable documentation. I have also used it to layout a web page idea to share with others and to show to the website designer. Because of how easy it is to move elements around, it would be very useful to use for Site Analysis or Schematic Design bubble diagrams when you are just trying to get relationships worked out. 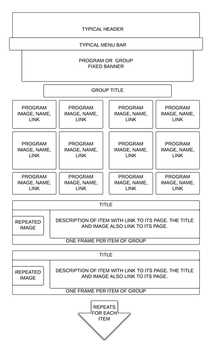 Web Page Example Web Page Example Lucidchart is a very handy tool for the occasional diagram. The learning curve is just minutes. The output is PDF, PNG, JPEG, VDX (Visio) or you can save it to Google Drive in its native format. The integration with Google Drive is nice but storing your files in folders in the Lucidchart cloud works fine too. There is a free version that allows 60 elements per chart. I have exceeded this limit a few times and then realized that I didn't need all the elements that I had. So generally the limit for the free version is not a handicap. The paid versions are not very expensive when paid annually: Basic - $3.33/mo for 100 Mb storage, Pro - $8.33/mo for 1 Gb storage, and Team - $21/mo for 5 Gb. See the subscription levels and features. Even if you don't use the free Google Chrome for your browser, it is worth getting it just for Lucidchart. To get Lucidchart go to the Google Web Store from a blank tab or window, search for Lucidchart, sign up so you can save your work, and you are ready to roll. Comments are closed.
|
x
Archives
February 2024
Categories
All
|
Architekwiki | Architect's Resource | Greater Cincinnati
© 2012-2022 Architekwiki
© 2012-2022 Architekwiki


