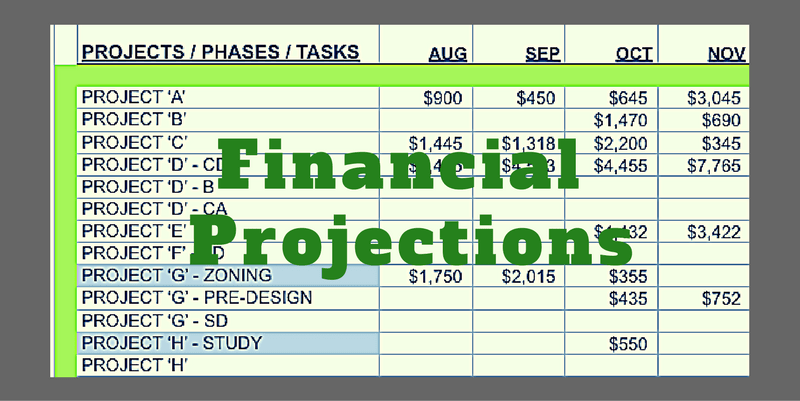
 I am going to share how to build a spreadsheet that you can use to project your financial future - kinda. Why 'kinda'? Well, because projections are notoriously 'iffy' - just too many unknowns. And almost all of them are beyond your control. But even a poor projection is better than the crossed finger method. I have used a spreadsheet like this for years to monitor our backlog of work. I have to admit that my interest in projecting fees into the future was usually because I feared that our work was drying up. It usually wasn't. Over time you learn that projections more than three months out aren’t very trustworthy - but really worth doing for the insights that your gain. 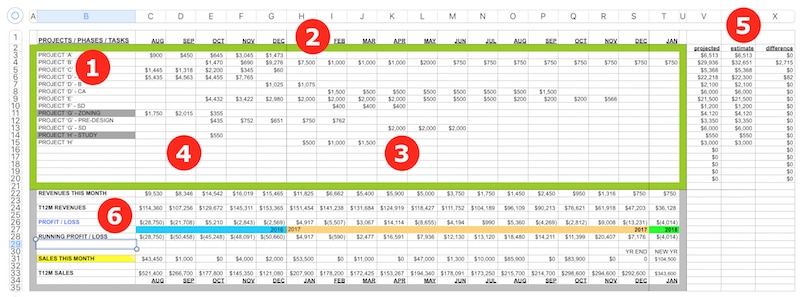 So let me explain what you are looking at and how you build it. Alternatively you could purchase a copy of this one for $10 and edit it. HOW TO BUILD IT I have a downloadable PDF of the spreadsheet that might be easier to follow along with. DOWNLOAD PDF. In the first column list all your active projects. This is just text. If you have "sub projects" or additional services, give them their own line. Sometimes it makes sense to list phases on their own line. The only rule is that it should make sense to you. These rows are never deleted. When they are no longer active, you hide them. I did this kind of maintenance whenever the height of the sheet got unwieldy. The gray highlight is my ‘note to self’ that this line can be hidden. 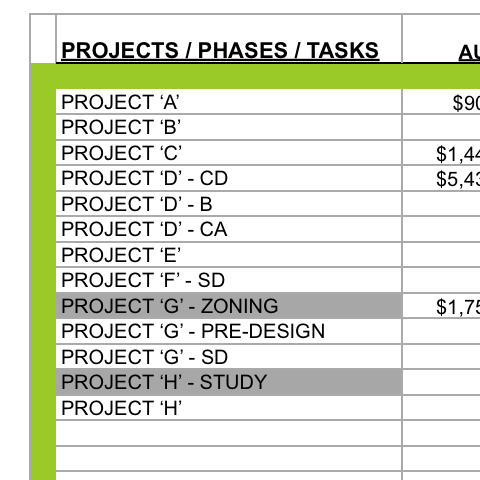  The column headers to the right of the first column represent months. These are text headers and aren't used elsewhere. I usually keep between 18 and 24 months visible. I liked to have all or most of the previous year visible plus the current year to about six months into the future. Once again these columns are never deleted. If you freeze the initial columns, you can go a year or so before feeling the need to hide the oldest months. In the example, 2016 is actual data and 2017 is projected data. 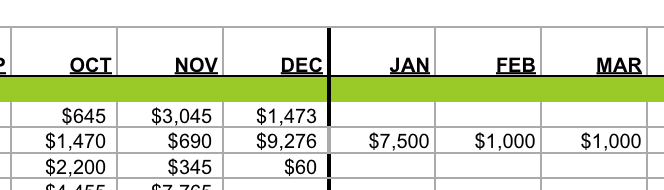 Tip If you are careful about adding new columns by selecting the last month before the vertical green border and adding columns to the right, you won't disturb either the formatting or the formulas. The green border acts as a buffer. Formulas include the green border in their range. This allows columns and rows to be added inside the border without affecting the formulas. Before Microsoft modernized Excel, these hidden rows and columns would really affect the size of the file. I haven't noticed that being an issue for years.  This area at the intersection of project names and the future months contains your projected revenue. These are numbers formatted as currency with comma separator, zero decimal places and negative numbers shown in parentheses. (Typical for all numbers.) The simplest way to allocate your remaining fee for each project, phase or service is to divide it equally over the months until you expect to be finished. You can find a downloadable spreadsheet here that makes quick work of that for you. 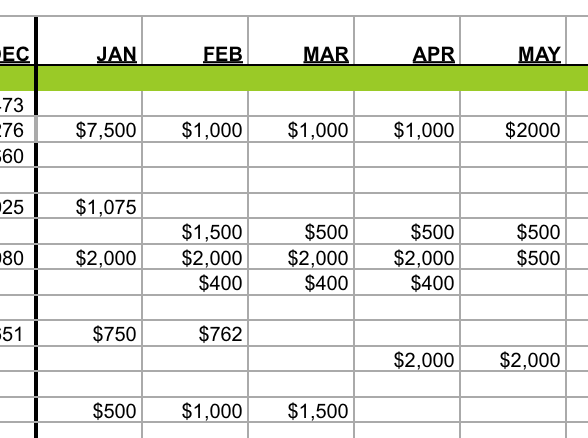 More About Projections I project net fees. I deduct expenses for consultants from the total (or gross) fee to get this net amount. When you include the consultants' fees the complexity increases much more than the effort it takes to remove them. If you are following standard practice and paying consultants when you are paid, including them in the projections is a wash anyway. With experience you will get a feel for projecting different types of fees. Construction Administration fees are front end and rear end loaded because of submittals at the beginning of construction and punch list and close out activities at the end. Construction Documents fees start slow, then standardize, then increase as the deadline approaches.  These are *actual* revenue results in the 'past' months. Use number format. You simply replace your projection with the amount that you invoiced (less consultants). 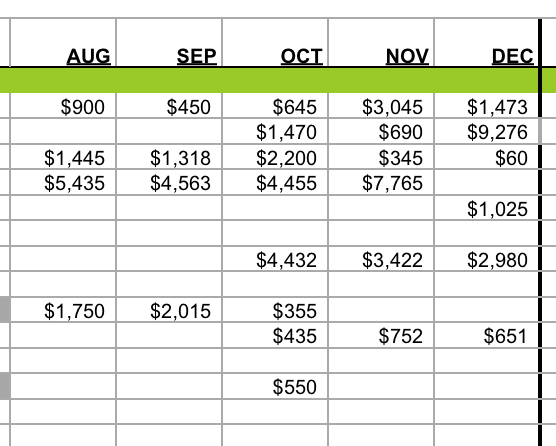  At the far right are three columns that act as checks and balances. The first contains a SUM formula that shows the total of all actuals and projections for that row. The second contains your net fee for this work. The third contains a formula that subtracts the SUM from the net fee to give you the amount of fee not allocated. These are number formatted. These columns are a big help. When you are projecting the fee, you can see how you are doing. When you are entering actual results, you can see how your remaining fee needs to be tweaked. 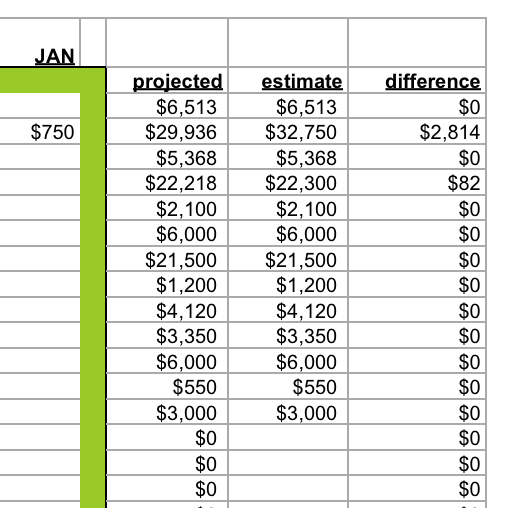 Time Commitment This 'maintenance' to update OFFPLAN takes about an hour per month. The original setup to build your own version will probably take most of a day or more to enter formulas, format and enter data. This depends on your spreadsheet skills and whether you want historical data or not. This is really about the future so I wouldn't spend much time on history. You will collect enough of that data soon enough. ...or you can get a spreadsheet ready to use for $10.  This area is where your results are shown. I will explain each row in this area from top to bottom. All are number formatted. Most of this information is the result of calculations by your built-in formulas. Two exceptions are 'EXPENSES THIS MONTH' and 'SALES THIS MONTH'. These numbers are actual amounts that you add when you update the spreadsheet. 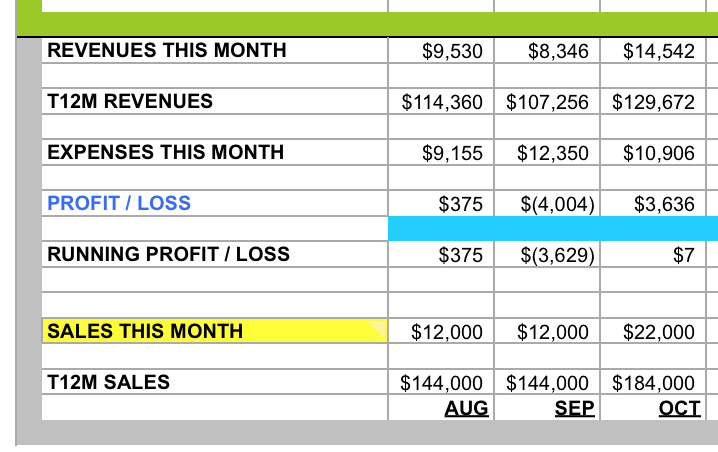  REVENUES THIS MONTH - This is a simple formula totaling of all the Projected or Actual net revenues for the month. T12M REVENUES - "T12M" is an an abbreviation for Trailing 12 Months. It is a formula that looks like this in excel: *@SUM(C22 - N22)* where C is the first month of a 12 month range and N is the twelfth month. I have faked the formula until you get to August in this spreadsheet. You will get approximate results if you research your revenues for the five ‘actual’ months and enter them. Your invoices have this info. The purpose of calculating the total revenues for the past 12 months is to track your trend in revenues. As this number goes up or down it is a much stronger indication of how you are doing than looking at monthly totals. It levels out the normal monthly ups and downs. Just one change in the T12M is cause for satisfaction or concern. Two monthly changes in the same direction is a definite trend. NET EXPENSES THIS MONTH - This is your projected or actual expenses without consultants. Depending on how you budget for expenses you may have this number for each month. If you budget by the year, put 1/12th of your annual expense budget here. If you don't budget at all, put 1/12th of last year's expenses from your tax return here. That is the projection side. Each month replace your projection with your actual expenses (less consultants). PROFIT / (LOSS) - This is revenues minus expenses. A simple formula. A positive number is profit. A negative number shown in parentheses is a loss.  RUNNING PROFIT / (LOSS) - This is a formula showing your year-to-date profit or loss. This is usually partly actual results and partly projected results. If you have a profit target you could insert a line of values above or below showing what your P/L should be for comparison. The formulas look like this, they add each month to the previous total: JAN: "=(H28)", a simple cell reference FEB - DEC: "=(I28)+(H30)" The Running Profit/Loss is a 'maintenance' item. The formulas have to be added for each new year that you 'open'. It is simple to do. Select the Jan-Dec formula cells of the previous year. Copy. Select the Jan cell for the new year. Then paste. Just in case, double-check that everything is calculating correctly. ADD SALES DATA The operations side of things is now set up to give you a way of projecting how your finances will look. But there won't be anything to project if you haven't got a stream of work coming in the door. This tool can't help with business development but it can track how your business development is going. That's what the next two lines do for you. SALES THIS MONTH - On this line add the net fee value of any new work that came in during the month. I usually added the individual values as a simple formula: "= fee1 + fee2 + etc". This makes finding where you added the fee easier in case there is a change. I also added the project in (1) and allocated the fee in (3) using the three columns in (5). The estimated fee in (5) and the recorded sales should agree so your T12M Sales is accurate. T12M SALES - Just like the Trailing 12 Month Revenue formulas, the T12M SALES formula shows you the trend. Declining results means that the future holds less work for your firm. Increasing results is good news unless you are already swamped. The T12M Sales number could be telling you a different story than your T12M Revenue number. So this formula extends the usefulness of projecting just your fees alone. Unfortunately it will take you a year to get this information. (I am assuming that you won’t want to take the time to discover when each sale was made over the past year.) That's All There Is To It The spreadsheet looks daunting because of its size, but it is actually pretty simple. Once set up you only need to do updates a couple of times a month when new work comes in or there is a change in scope for ongoing work. Then you do monthly updates when you have invoices and expense results. Once every six months or so add six months' worth of columns. This is really valuable information for less than a dozen hours worth of effort spread out over the year. Kickstart your Financial Projections with OFFPLAN. There are three formats. .xlsx, .number, and .xls Just $10
0 Comments
Your comment will be posted after it is approved.
Leave a Reply. |


x
Archives
February 2024
Categories
All
|


Architekwiki | Architect's Resource | Greater Cincinnati
© 2012-2022 Architekwiki
© 2012-2022 Architekwiki